Problem
Performance is always a key factor when using SQL Server and should be thought about before the initial setup of the server as well as when the application is being used in production. In this tip I cover the approach I like to take when setting up and tuning my SQL Server environments.
Solution
Performance tuning is a big subject and there are a lot of different pieces to troubleshooting a poor performing database or application. I like to use the 5 level process shown below:
- Server Hardware
- Operating System
- SQL Server
- Database
- Application
Hardware
When troubleshooting poor performance don't always assume it's something wrong with the database itself. The problem often lies deeper. We'll start with hardware. If the hardware isn't up to par, your OS, database, and application will suffer.
One of the best tools to monitor hardware are counters that are part of the Performance Monitor, or PerfMon for short. I'm not going to go into how to use PerfMon, which can be covered in a different tip, but I will tell you some of the most important counters to watch and a description of what they do.
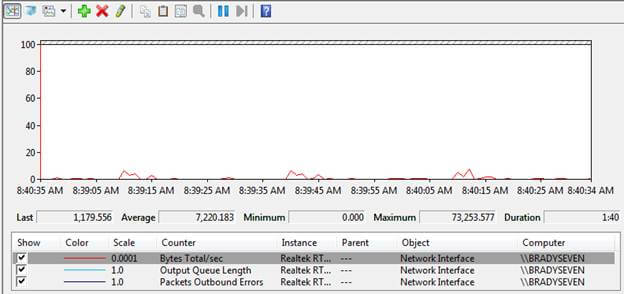
Network Counters:
- Network Interface: Bytes Total/sec - Bytes Total/sec is the rate at which bytes are sent and received over each network adapter, including framing characters. Network Interface\Bytes Total/sec is a sum of Network Interface\Bytes Received/sec and Network Interface\Bytes Sent/sec. This value should be pretty low.
- Network Interface: Output Queue Length -Output Queue Length is the length of the output packet queue (in packets). If this is longer than two, there are delays and the bottleneck should be found and eliminated, if possible. Since the requests are queued by the Network Driver Interface Specification (NDIS) in this implementation, this should always be 0.
- Network Interface: Packets Outbound Errors - Packets Outbound Errors is the number of outbound packets that could not be transmitted because of errors. This value should stay at 0 also.
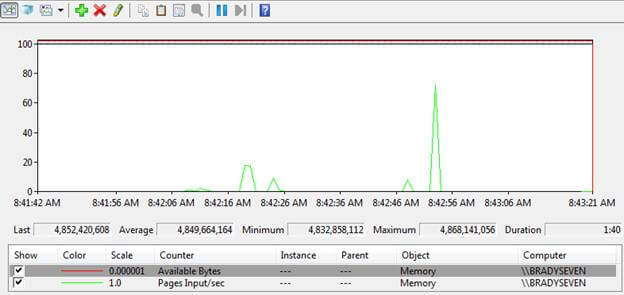
Memory Counters:
- Memory: Available Bytes - Available Bytes is the amount of physical memory, in bytes, immediately available for allocation to a process or for system use. It is equal to the sum of memory assigned to the standby (cached), free and zero page lists.
- Memory: Pages Input/sec - Pages Input/sec is the rate at which pages are read from disk to resolve hard page faults. Hard page faults occur when a process refers to a page in virtual memory that is not in its working set or elsewhere in physical memory, and must be retrieved from disk. When a page is faulted, the system tries to read multiple contiguous pages into memory to maximize the benefit of the read operation. This value should stay around 0 except for occasional spikes.
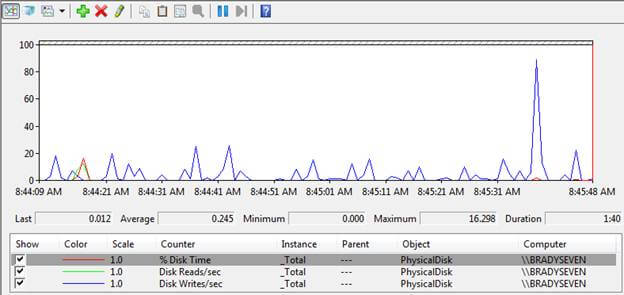
Hard Drive Counters:
- Physical Disk: Disk Reads/sec - Disk Reads/sec is the rate of read operations on the disk. This value should stay under 13 milliseconds with the lower the milliseconds, the better.
- Physical Disk: Disk Writes/sec - Disk Writes/sec is the rate of write operations on the disk. This value should always stay under 100 milliseconds.
- Physical Disk: % Disk Time - % Disk Time is the percentage of elapsed time that the selected disk drive was busy servicing read or write requests. This value should stay below 65% for the most part.
CPU Counters:
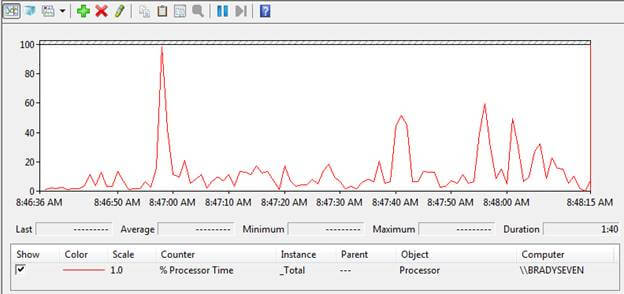
- Processor: % Processor Time - % Processor Time is the percentage of elapsed time that the processor spends to execute a non-Idle thread. It is calculated by measuring the percentage of time that the processor spends executing the idle thread and then subtracting that value from 100%. (Each processor has an idle thread that consumes cycles when no other threads are ready to run). This counter is the primary indicator of processor activity, and displays the average percentage of busy time observed during the sample interval. It should be noted that the accounting calculation of whether the processor is idle is performed at an internal sampling interval of the system clock (10ms). On today's fast processors, % Processor Time can therefore underestimate the processor utilization as the processor may be spending a lot of time servicing threads between the system clock sampling interval. Workload based timer applications are one example of applications which are more likely to be measured inaccurately as timers are signaled just after the sample is taken. This value, obviously, shouldn't stay at 100%. Look for values around the 50 or 60%.
Another good tool for managing hardware is Windows built-in Task Manager. In Task Manager you can watch processor utilization, memory utilization, and networking utilization.
Operating System
Once we have the hardware running optimal on our system we will move on to the Server OS.
Some things to consider involving the OS:
- What edition do I need? Standard, Enterprise, Datacenter
- Do I need 32 bit or 64 bit?
- Am I going to install any other programs on this server that may use resources?
- How am I going to split up my disks?
This list may vary depending on if the server is being used as a Production server or a Development Server.
Before installing SQL Server there are also a few things that you need to consider:
- What edition of SQL Server do I need? Standard, Enterprise, Developer
- What features do I need to install? SSIS, SSRS, SSAS
- What prerequisites do I need to install?
- Is this going to be in a cluster, mirror, etc?
SQL Server
Now that we have the hardware optimized, the server OS installed and all pre-installation tasks ironed out it's time to install SQL Server and configure the server properties.
While installing SQL Server make sure you add only the features you need. If this is not going to be a report server then there's no need to install Reporting Services. Also, it is recommended that when choosing a service account consider the principle of least privilege. The service account should have exactly the privileges that it needs to do its job and no more.
Once installed, you will probably need to do a little configuring. To do this, right click on the server and choose Properties. (See below)
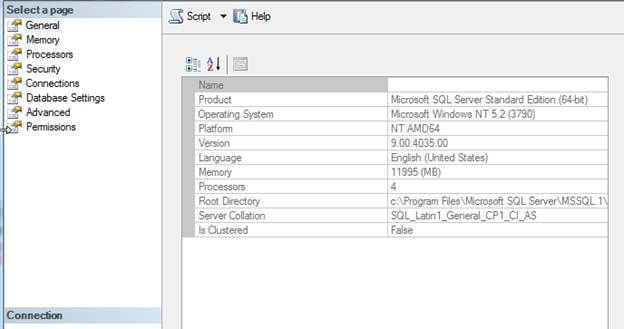
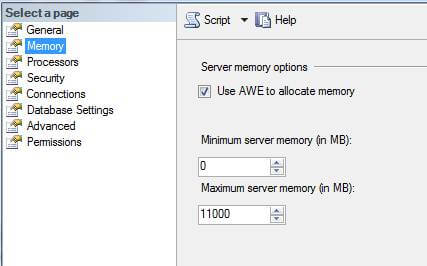
While all the server properties are important, the memory tab is one I check every time I do an installation. If you're running a 32 bit server and have over 4 GB RAM installed and want SQL Server to use more than 4 GB, AWE needs to be checked. (AWE does not apply to 64 bit servers) You may also check the minimum and maximum server memory if you need memory allocated elsewhere.
There are also tons of PerfMon counters that can help tune SQL Server itself.
A few examples of SQL Server Perfmon counters to monitor are as follows:
SQL Server Memory Counters:
- SQLServer:Buffer Manager - Page life expectancy - Number of seconds a page will stay in the buffer pool without references.
- SQLServer:Memory Manager - Total Server Memory - Total amount of dynamic memory the server is currently consuming
- SQLServer:Memory Manager - Target Server Memory - Total amount of dynamic memory the server is willing to consume
- SQLServer:Memory Manager -Memory Grants Pending - Current number of processes waiting for a workspace memory grant
SQL Server CPU Counters:
- SQLServer:SQL Statistics - Compilations/sec - Number of SQL compilations.
- SQLServer:SQL Statistics - Recompilations/sec - Number of SQL re-compiles.
SQL Server Hard Disk Counters:
- SQLServer:General Statistics - User Connections - Number of users connected to the system
- SQLServer:Access Methods - Page Splits/sec - Number of page splits per second that occur as a result of overflowing index pages.
- SQLServer:Access Methods - Pages Allocated/sec - Number of pages allocated per second in all databases in this SQL Server instance. These include pages allocations from both mixed extents and uniform extents.
- SQLServer:Access Methods - Range Scans/sec - Number of qualified range scans through indexes per second.
Database
Almost there, all we need to do is tune the database and the application.
Tuning at the database level starts as soon as you create the database. When creating a database it is recommended that you put your data file and log file on separate disks to increase performance. A few other things to think about when you're creating your database is setting the initial size to a comfortable size so it doesn't grow after every transaction, setting the autogrowth to an optimal level, setting the recovery model, etc. These are all things you can take care of before the database is created.
Once the database is created and data has been inserted, two of my favorite tools to monitor query performance which I won't explain in great detail are as follows:
- SQL Server Profiler - a graphical user interface to SQL Trace for monitoring an instance of the Database Engine or Analysis Services. You can capture and save data about each event to a file or table to analyze later. For example, you can monitor a production environment to see which stored procedures are affecting performance by executing too slowly. (from BOL)
- Database Tuning Advisor - helps you select and create an optimal set of indexes, indexed views, and partitions without requiring an expert understanding of the structure of the database or the internals of Microsoft SQL Server. (from MSDN)
- Also, DMV's are heavily used for troubleshooting databases.
Application
Now that your Hardware, Operating System, SQL Server, and databases are tuned and performing optimally the last thing to tune is your application. Lucky for me, that's where I turn it over to our developers and have them run through their code and make sure everything is written properly and review the volume of objects to see whether or not they need to be kept in the application.
Comentarios
Publicar un comentario